Google continues to release an impressive library of rich API tools that can be used by developers to create charts, gadgets that are easy to implement and are portable. In this post we create a simple guage that shows the effects of more users on the Server throughput. Clicking on More users or Less users shows the effect on the Server throughput, typically measured in requests per second. Click here for a demo of the same!
The sample code was well structured and easy to incorporate into my page, although there are a few hiccups (such as not showing up correctly on an iPhone or an iPad), but this beats the alternative of writing your own script. What is more impressive, is that these calls are very fast! You can change the Google sample code interactively by going to their site at:
http://code.google.com/apis/ajax/playground/?type=visualization#gauge_interaction.
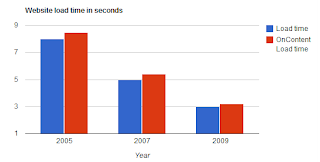
Discuss the trends of viewers visiting web sites and the amount of time they wait for a site to load.
Wednesday, July 27, 2011
Acceptable Web site load times over the years
There are 200million web sits (and growing!) as I write this blog. Everyday a new device using the OpenSource Android platform is getting released... Tablets, laptops, Smartphones and the good old desktop are all being used by consumers, each running a different browser and an Operating System. Till two years ago, there were only 2 browsers and now we have 4 serious contenders jostling for space. Your site has to work on every combination mentioned above! Here are some specifics about how a web site experience is perceived on various devices:
- Users expect the sites to load as fast on mobile phones as they would on Laptops and Desktops
- Users expect the site to format the data automatically to fit the size of the screen on their device
- Users who have a bad experience visiting a site on their mobile device tend to not visit the site afterwards
In addition, search engines are continuously tweaking their Ranking algorithms so as to ensure a fair playing field. SEO (Search Engine Optimization) a field that has taken a life of its own now is a thriving business as sites try to rise above the noise to rank high on searches (remember there are at least 200million web sites now!).
The graph above was created using Google Visualization Chart and the Google script does not work on this blog; if you want to see how it works, click here.
Subscribe to:
Posts (Atom)